Tutorial Contents
Introduction
Sample Design
The
Framework
Starting
Active-VHDL
Creating
a New Design
Design
Browser
Editing
Code
Checking
Syntax
Compilation
Design
Structure Viewing
Library
Manager
Simulation
Adding Files to the Design
State
Machine Editor
Creating
the Top Level File
Compiling
Entire Design
Simulating
the Design
Benefits
Welcome to the ALDEC newest product – Active-VHDL simulator.
The tutorial will guide you through the amazing world of the integrated VHDL tools.
This tutorial requires basic knowledge of VHDL. If you have none, a good starting point is
ALDEC’s EVITAä InterActive-VHDL Tutorial
with Applications. Its limited version is available on http://www.aldec.com
website
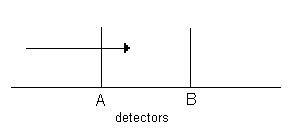
The design, that you will work on in this tutorial, is a
simple device which counts objects passing through the gate.
It comprises a decade counter and a control unit.
Gate:
A passing object first activates the A detector and then
the B detector.
We assume that:
The control unit scans the detectors and when the
appropriate condition is met it generates an impulse which advances the counter.
Description of possible combinations:
The Active-VHDL framework is based on a standard MFC-like GUI interface. Each window can be dockable, overlapped or application-like.
The main parts of the Active-VHDL are:
To start working with the program go to the Start->Programs->Active-VHDL
program group and click the Active-VHDL label. The Active-VHDL should start
loading.
When the loading process finishes the following dialog appears:
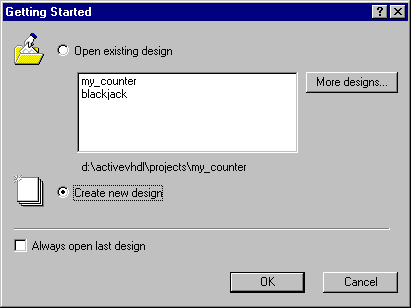
Select the Create new design option, and then click the OK button.
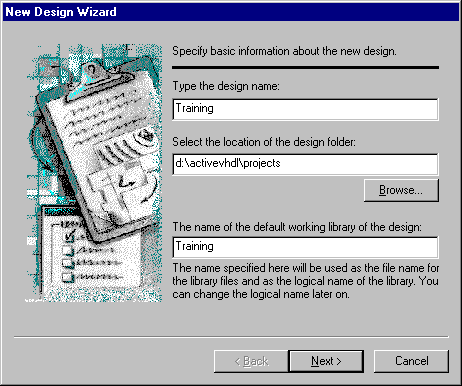
Entering a design name
Active-VHDL features an easy-to-use New Design
Wizard invoking by selecting the Create new Design option in the Active-VHDL Welcome
window.
The first New Design Wizard dialog allows entering a design name and a directory
name where the project’s
files are to be placed.
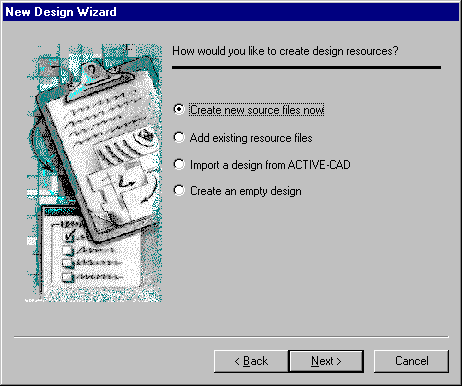
Specifying the contents of a design
The next dialog lets you specify the contents of the design
you are creating.
You can:
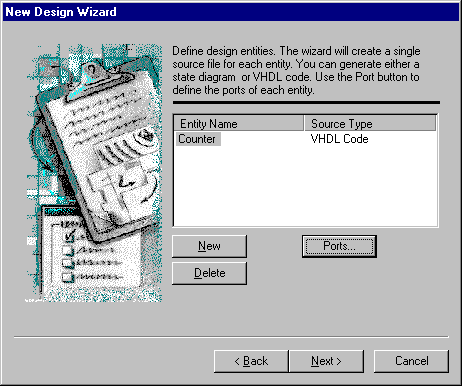
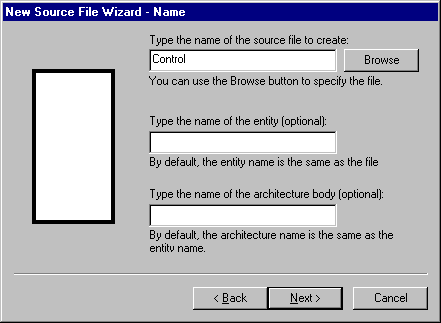
Creating the skeletal source file
In the following dialog you can add components you want your design to be comprised of.
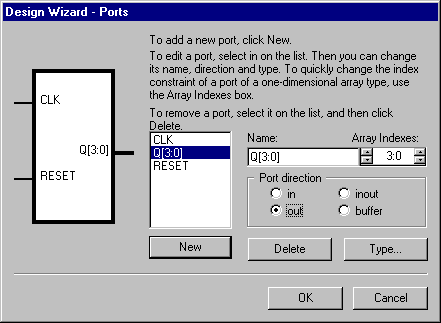
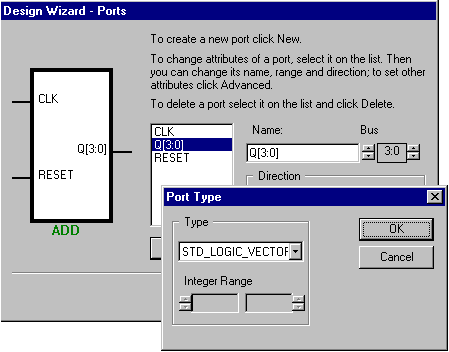
Ports Wizard
Ports Wizard is a useful tool for entering ports. It
generates a VHDL source code template based on the entered port descriptions.
What you need to do is to click the New button and type a port name in the Name
box.
You can specify the direction of a port using the Port direction controls.
If you want to enter a bus, you can set its range in the Array Indexes box.
Accepting the properties of a design
The last dialog is a confirmation dialog displaying your
design properties.
If they are correct, click the Finish button to complete the design creation.
Use the Back button if the settings are incorrect.
Use the Cancel button if you don’t want to create the new design.
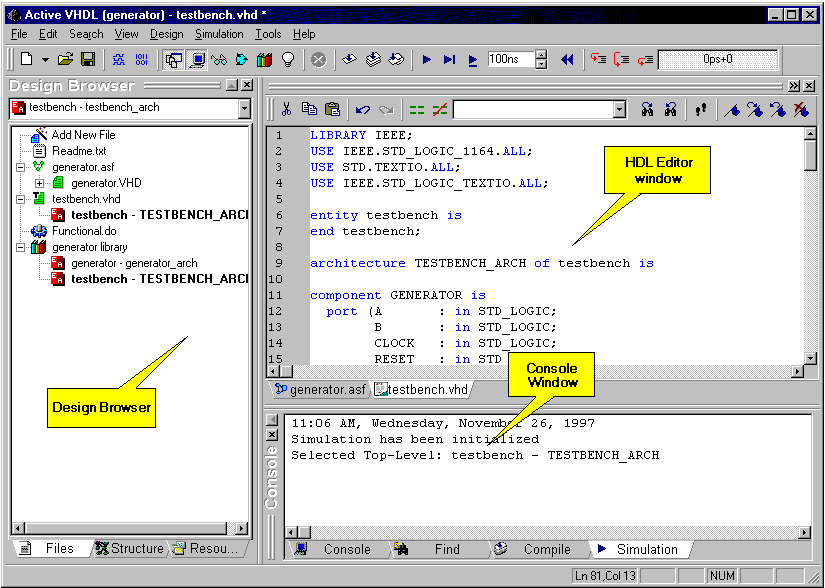
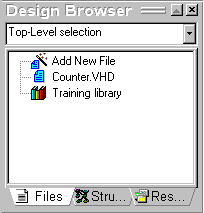
The next paragraph introduces the Design Browser.
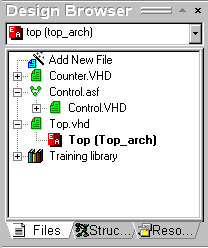
The Design Browser is a window showing the design contents. It consists of three tabs:
As a result of the previous operations you will receive the following window:
HDL Editor
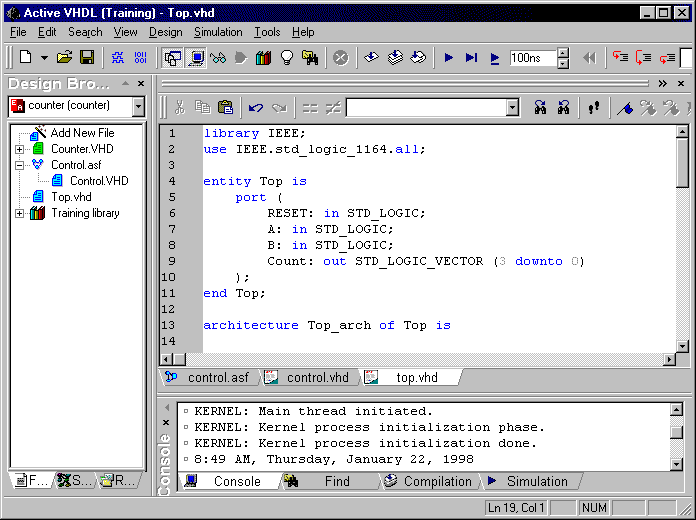
The HDL Editor is a text editor with VHDL keywords coloring and standard editing features.
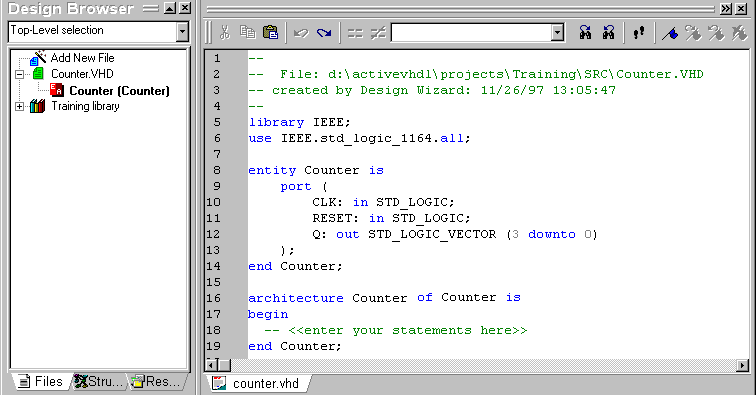
If you have followed all the steps, you will see the window
as shown above.
The generated code is a template based on your port settings.
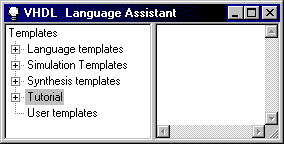
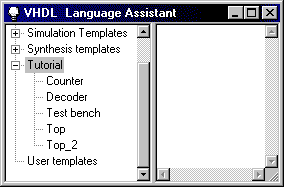
Language Assistant
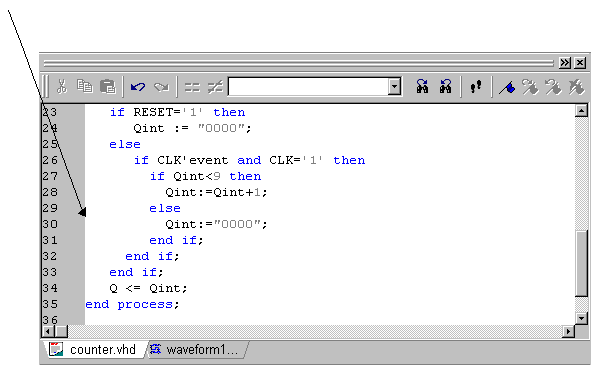
Let’s describe a structure of the "Counter".
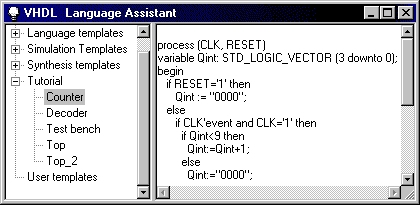
In the above preview window there is a VHDL process
description of a BCD counter.
Now, we will paste the template into the code.
Adding libraries
The edited code requires some additional packages to be
included.
The following line has to be added after the use IEEE.std_logic_1164.all:
use IEEE.std_logic_unsigned.all;
The result is:
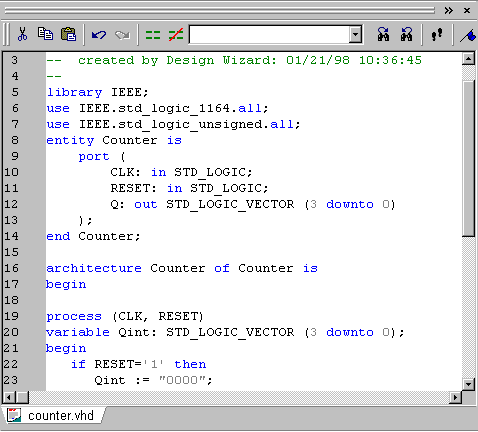
You have just edited the "Counter" unit.
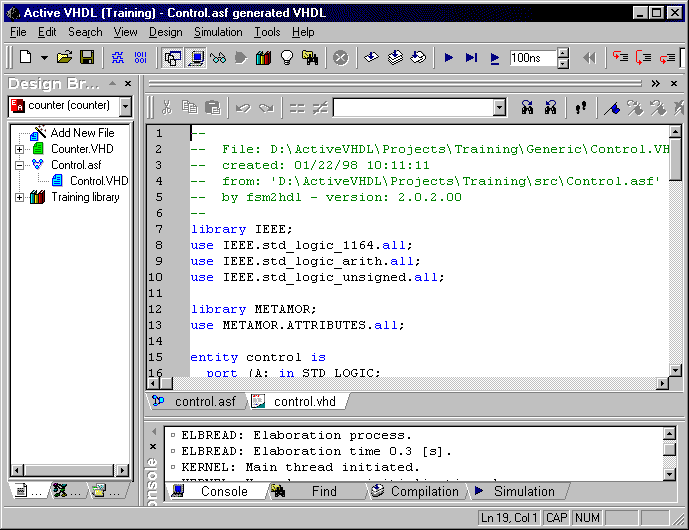
Go to the Design Browser window, select Counter.vhd label and click the right mouse-button. Choose the Compile option from the shortcut menu.

If there is any error, the icon changes to yellow,
erroneous line is underlined and the VHDL console window contains the error description.
If you want to see how errors are displayed, delete the first letter from the library
statement and perform the syntax check.
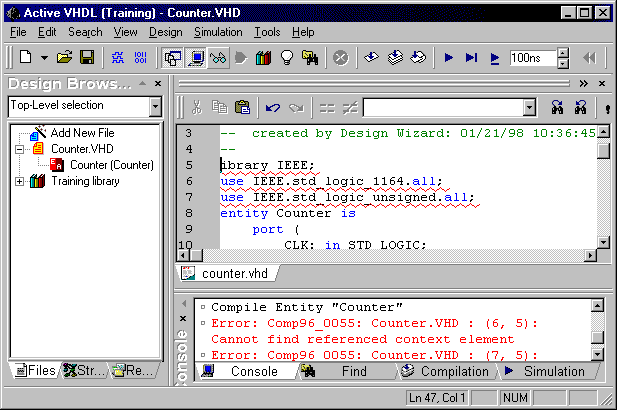
Re-type the letter to reverse to the previous error-free state.
Before proceeding with any simulation, the design has to be
compiled.
If you want to compile only one file, you can select it and choose the Compile
option from the right-button shortcut menu.
If you want to compile several files at the same time, choose the Compile All option.
As your design contains only one source file, select Compile from the shortcut menu. The compilation is needed, as you have only edited the file in the previous paragraph.
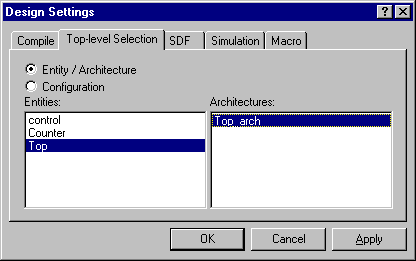
Next, you have to specify your top level entity.
Note: To specify the top level entity you can also:
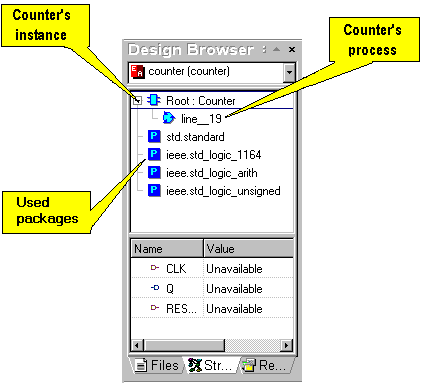
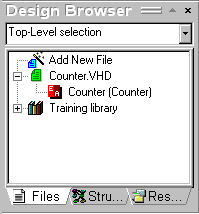
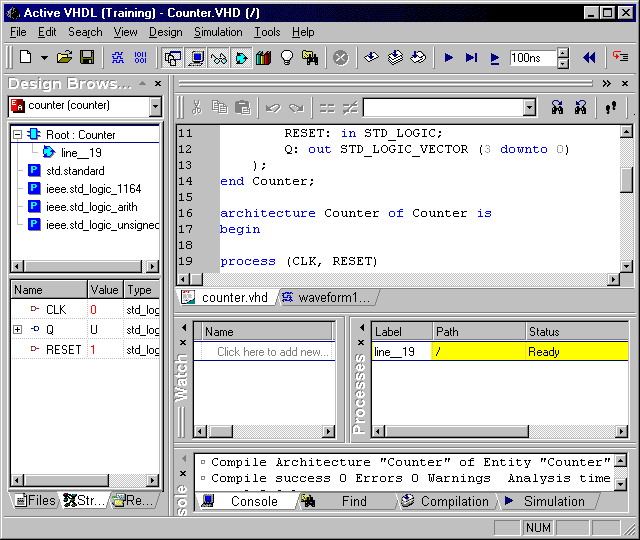
The Structure tab shows the structure of a design.
Counter is the top design entity, which is indicated by the Root label of
the Counter component.
As shown in the picture, the Counter component has one concurrent process, by
default called line_19 Also all the used packages are displayed.
Each design unit can contain ports, signals and variables. Active-VHDL
allows easy browsing through the unit data.
If you click a component on the Structure tab of the Design Browser, its
local data will be displayed in the lower panel of the window.
Let’s verify our design.
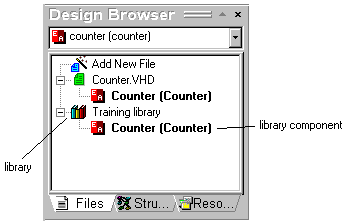
Each VHDL source file is compiled to the specific library.
The default library for the design files has the same name as the design name and is
displayed on the Files tab of the Design Browser window, in the hierarchy
tree.
VHDL files can be compiled to any existing library, which can be selected using the File Properties dialog. To open the dialog click the selected VHDL file with the right mouse button, and then select Properties from the shortcut menu.
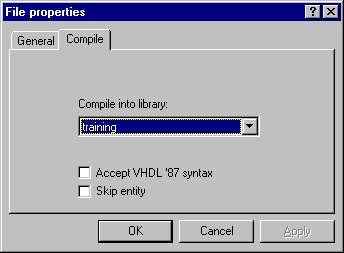
To change the default library for the compilation output,
switch to the Compile tab.
Since the VHDL language supports packages, each of them can be compiled to a different
library.
You can see libraries and their contents using the Library Manager window, that is open when the Library Manager option is selected from the View menu.
Go to the View menu and choose the Library Manager item. The following window will open:
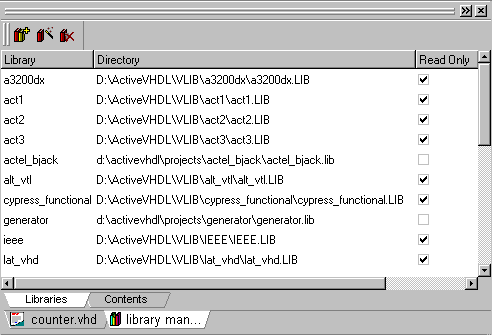
Select the IEEE label and switch to the Contents tab.

This window contains packages compiled to the IEEE
library and available for the user.
Close the Library Manager.
Starting simulation
To begin a simulation, you have to initialize the simulator
first, using the Initialize Simulation option from the Simulation
menu.
After the simulator has been initialized, a new Waveform window must be opened by
clicking the New Waveform toolbar button ![]() . The new
Waveform window can also be opened by selecting New -> Waveform from the File
menu.
. The new
Waveform window can also be opened by selecting New -> Waveform from the File
menu.

You can switch between different document windows using tabs located at the bottom left-hand corner of each window.
After opening, the new waveform window is initially empty. You have to add signals, which waveforms you want to observe. You can add signals using the drag and drop feature. On the Structure tab of the Design Browser, select the component whose ports you want to observe and simply holding the left button, drag it to the left-hand section (pane) of the waveform window and release the button (typical drag-and-drop operation). You can do the same with separate signals listed in the lower pane of the Structure tab.
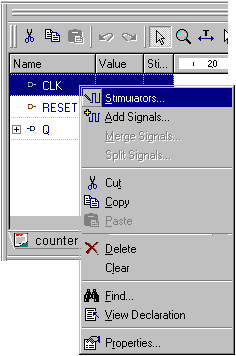
If you want to delete a signal, select it and press the right-button. A pop-up menu comes up containing the Delete item. Choose this option to delete the signal. You can also add or delete signals from the shortcut menu invoked by the right mouse button clicking in the left part of the Waveform window.
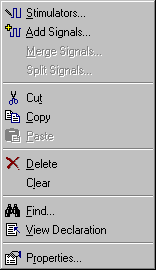
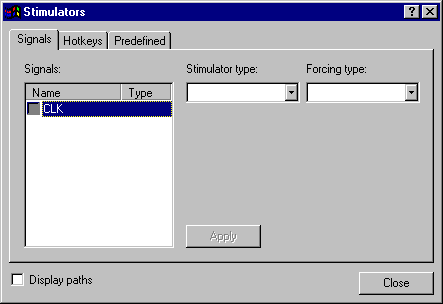
Assigning stimulators
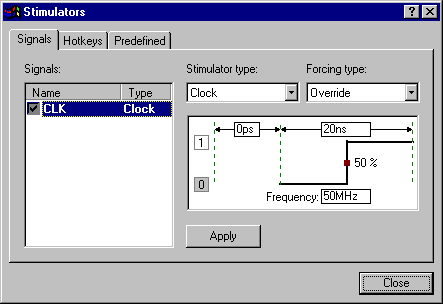
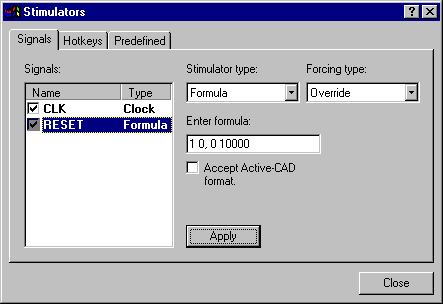
Formula expressions use the following syntax:
<value> <time>,.....,<value> <time> <-r period>We will not use –r switch as it suits for periodical waves.
The entered formula drives RESET as follows:
- High state for 10 ns, starting from 0 ns - 1 0 in the expression
- after 10 ns (10000 ps) a Low state is assigned to the signal – 0 10000 in the expression
Let’s simulate!
You can perform either a single step simulation, which is useful for source code debugging, or a continuous simulation, for high speed design analysis and results comparison.
See the picture below:
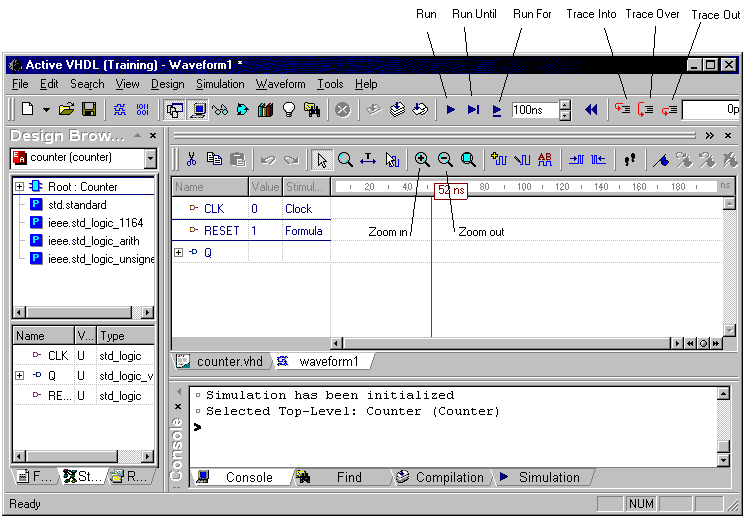
Perform several simulation steps by clicking the Trace
Over button.
You can also click on the Run For button which performs simulation for the time
specified in the box located on the right of the Run For button.
You will receive the following results:
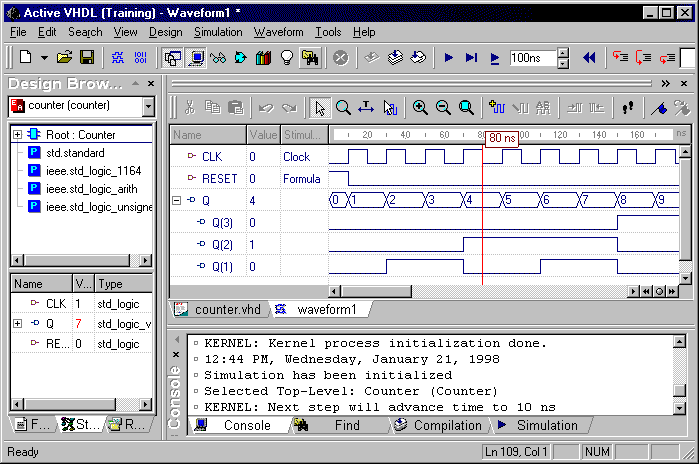
The Q bus has been expanded by clicking the "+" sign next to the label.
Editing waveforms
You can change data format of the displayed signals using the signal Properties dialog.
To open the Properties dialog, choose Properties
from the shortcut menu for the previously selected Q signal.
The options grouped in the Format and Colors fields allow you to customize
the way the signal waveform is displayed.
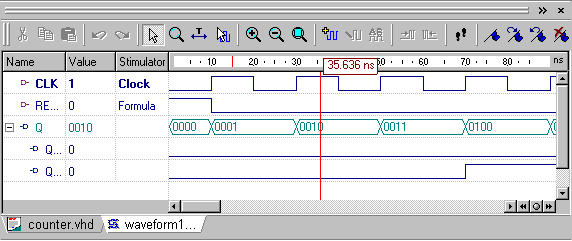
The signal is a vector and vectors are always displayed in the Literal mode. Change
the display radix to Binary by selecting the appropriate option button.
Code source tracking
Active-VHDL allows easy debugging of the source code in step mode simulation. The step mode simulation is automatically entered after pressing any of the Trace buttons. Step mode simulation automatically switches on the feature of yellow highlighting of the code statement that is currently scheduled for execution. To examine the current values of design signals and variables, open the Watch window by selecting Watch from the View menu. Signals can be added to the Watch window in the same way as for Wavefom and List windows. You can also select Processes from View to open the Processes window, that shows the current status of design processes.
If the HDL Editor window is hidden, click the Counter.vhd tab. The yellow bar will move, as you click the Trace In, Trace Over or Trace Out button. The signal values displayed in the Watch window will change if the lately executed statement has changed any of them.
Perform several simulation steps using the Trace Over button.
Setting breakpoints
If you want the continuous simulation to stop at the specified location in the source code, you can specify a breakpoint.
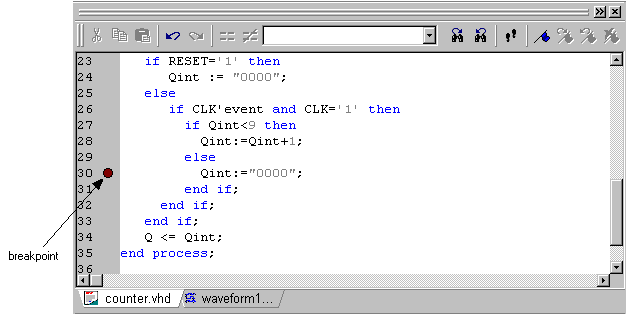
Enabling breakpoints
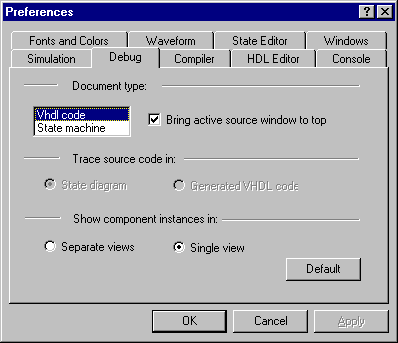
To arrange for automatic displaying the source code at the moment the breakpoint is reached:
List window
The Waveform window contains simulation data in the form of graphical waves, however, it is often desired to have a list of events for more detailed design verification. It is especially useful for glitch detection and exact delay measurement. Active-VHDL features the List window, as shown below.

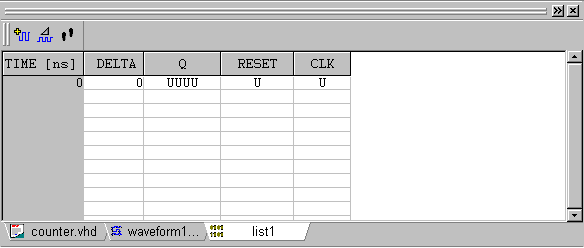
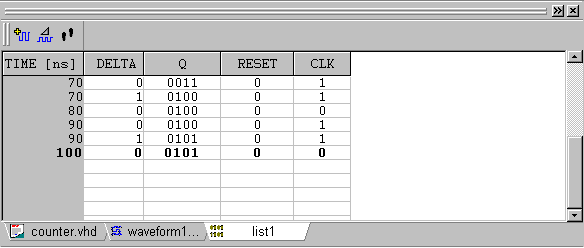
The time values can be different as they depend on the simulation progress.
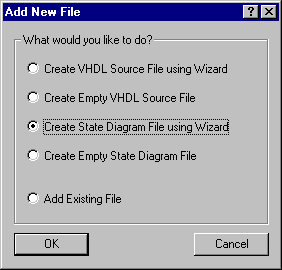
You can add new files to your design by clicking the Add
New File icon ![]() on the Files tab of the Design
Browser. The Add New File dialog will open.
on the Files tab of the Design
Browser. The Add New File dialog will open.
This dialog allows you to specify ports.
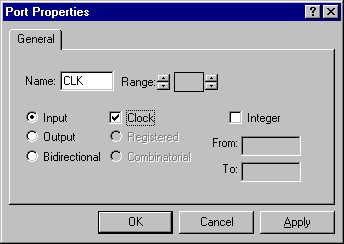
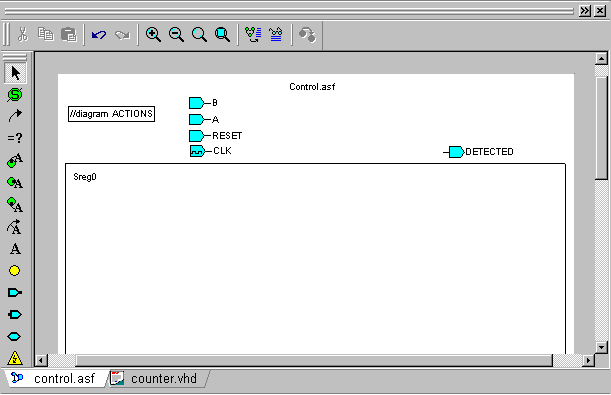
- CLK input, STD_LOGIC
- RESET input, STD_LOGIC
- A input, STD_LOGIC
- B input, STD_LOGIC
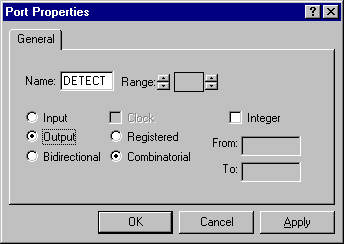
- DETECTED output, STD_LOGIC
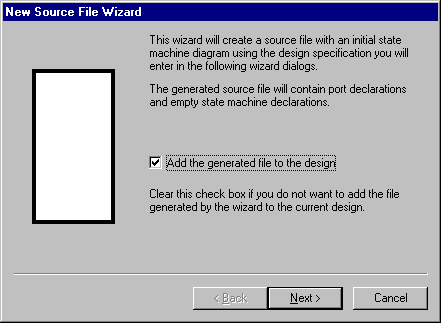
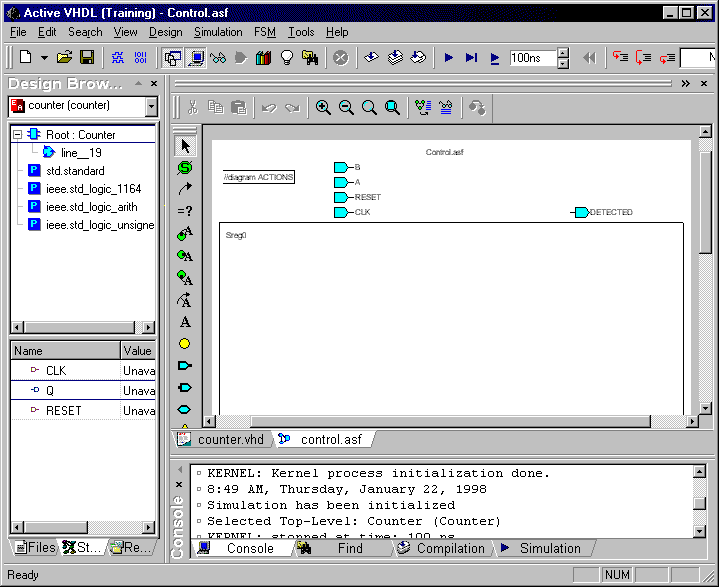
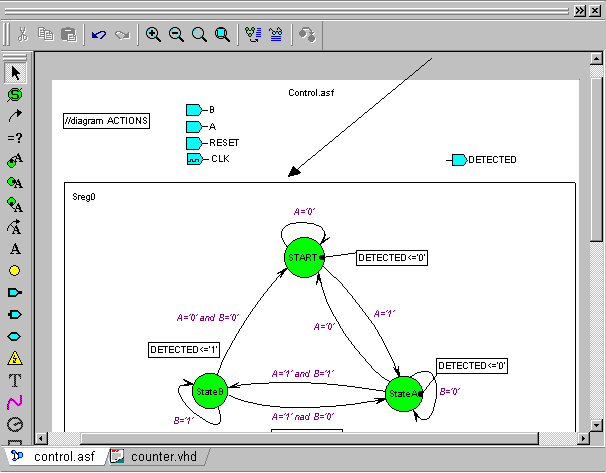
You have just created a state machine template as shown below.
Introduction
State Machine document is divided into two parts: declaration header and the state machine workspace.
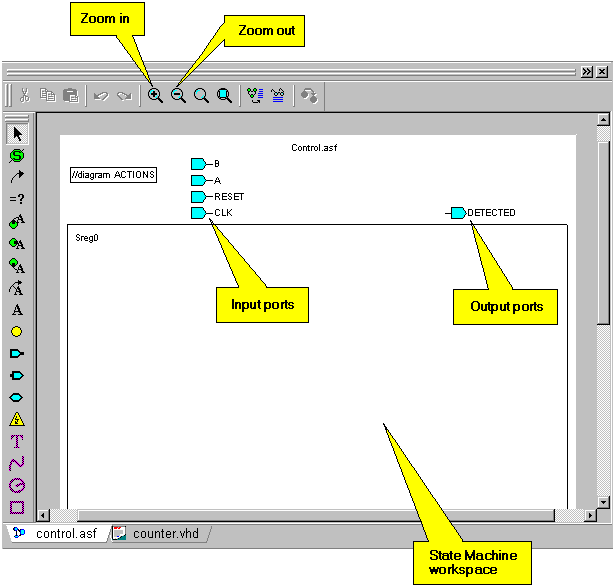
The declaration header can contain the following icons:
input port |
|
output port |
|
bidirectional |
|
clock port |
|
registered output port |
|
internal signal (variable) |
|
These icons represent module’s ports and signals.
The state machine’s
workspace is a place where a state diagram is edited.
Editing state machine ports
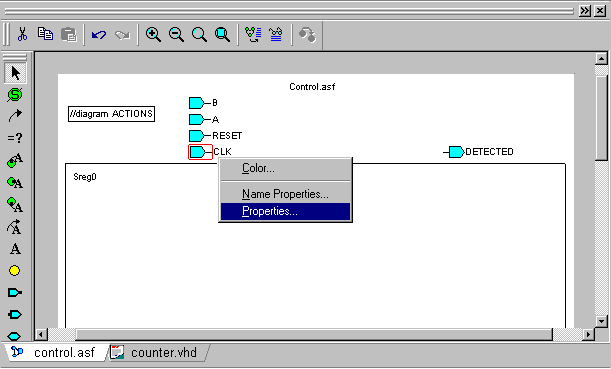
As state machines are synchronous, they always have a clock. In State Machine Editor (FSM) only one signal can be used as a clock. This paragraph shows how to specify a state machine clock.
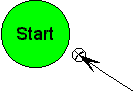
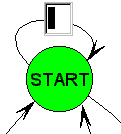
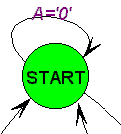
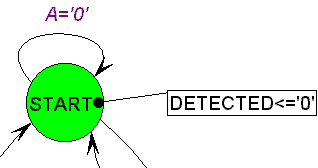
Placing state bubbles
State bubble ![]() indicates a
state in a state machine.
indicates a
state in a state machine.
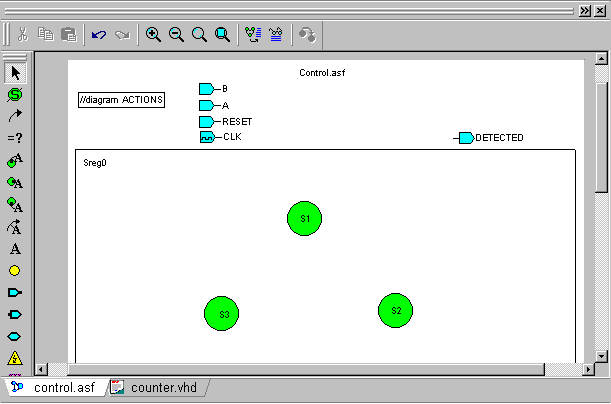
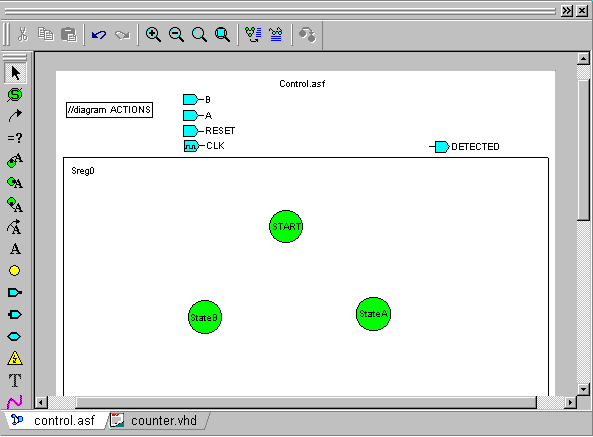
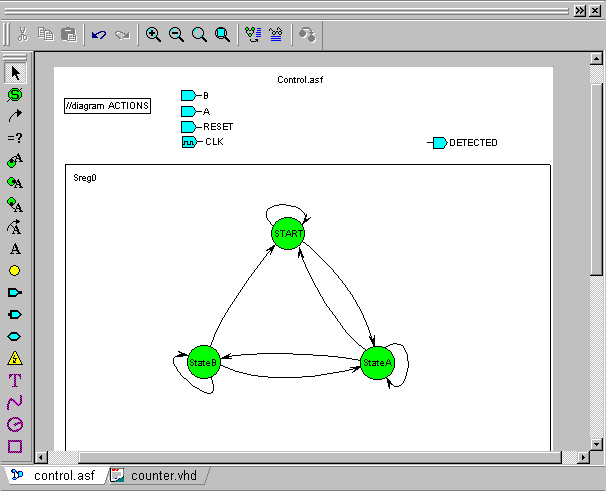
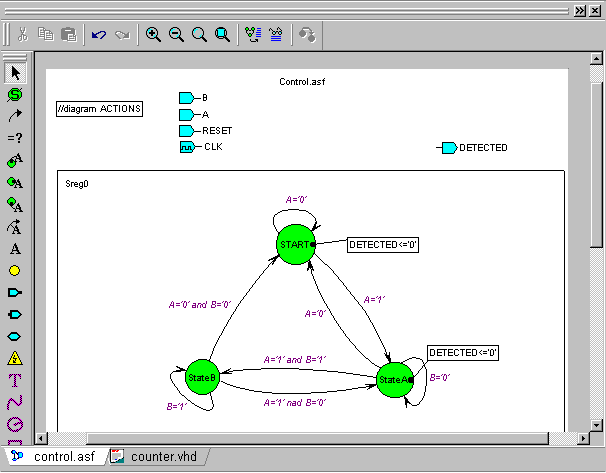
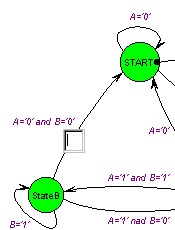
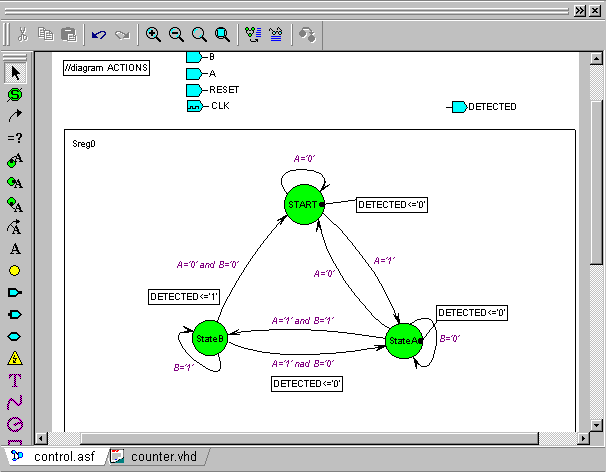
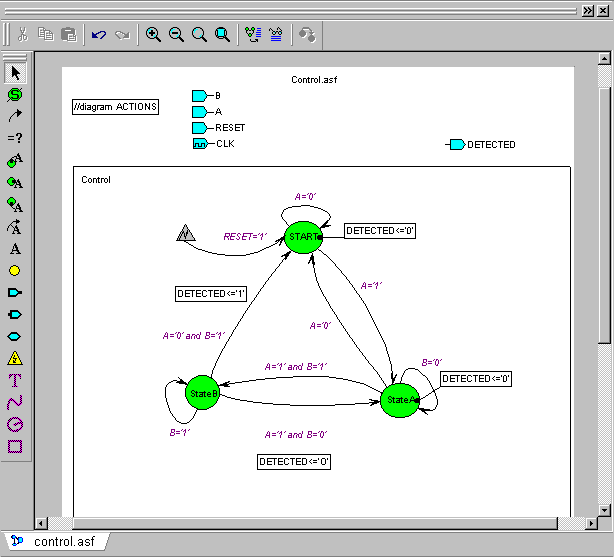
Since our control unit needs three states, we will place three state bubbles in the FSM
diagram.
To place a state bubble do the following:
You should get the following picture:
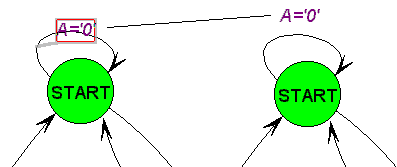
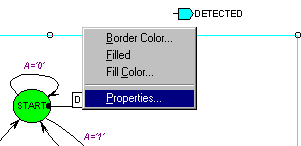
Editing a state bubble
Each state bubble must have the unique name. FSM generates default names starting with "S" and followed by a number. The user can change, at any time, the bubble’s name, color and size.
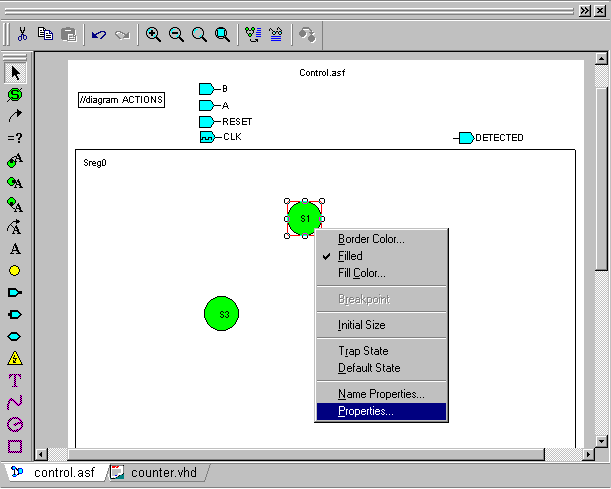
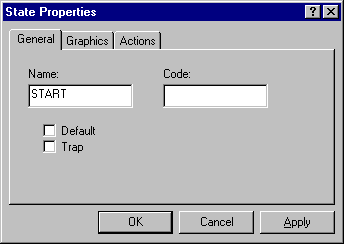
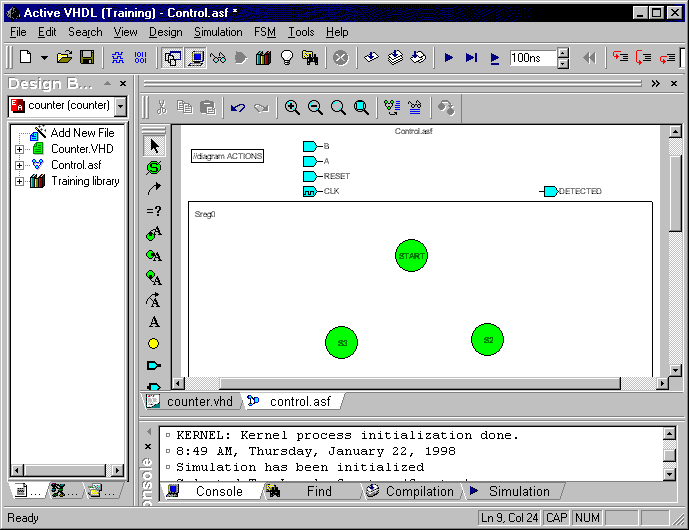
To edit the S1 and S2 states names:


Do the same with the S3 state, changing its name to StateB.
To change the size of a bubble, click inside its body, but outside the bubble’s name. A set of 8 small rectangles around the selected bubble will appear. Click one of the four rectangles located in corners and drag them to the desired location. If you do the same with one of the remaining four rectangles, you will change the bubble shape to oval.
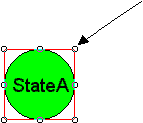
The bubble can be moved by pressing the left button on its body and releasing in the desired location. The bubble name can be moved in the same manner.
You should get the following results:
You can add, delete and edit ports by using the Input
port ![]() or the Output port
or the Output port ![]() toolbar
buttons.
toolbar
buttons.
Every time you make changes you should save the file using the Save option from the File menu, but remember to activate the FSM window by clicking in the state diagram document area.
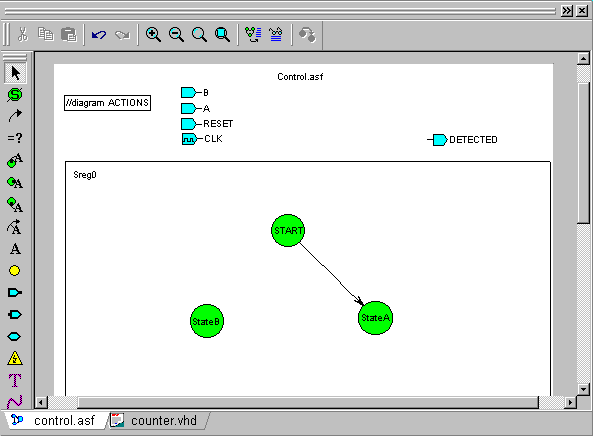
Adding transitions
Transition lines describe the behavior of a state machine. A transition line shows the change of a machine state when the specified transition condition occurs. It is displayed as an arrow pointing from the current state to the destination state.
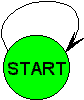
If you want a state machine to stay in the same state, you can draw a transition where the starting point and the destination point are placed on the same bubble.
Editing transitions
Each transition can be edited at any time. You have to
select the transition and press the right-mouse button to display the shortcut menu.
The selected transition can be moved and resized by moving the small rectangles at the
ends of the transition.
To bend a transition line, you have to move the small
rectangles located in the middle of the line.
To delete the transition line, select it and press the DEL key.
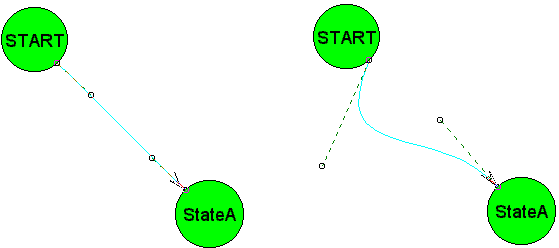
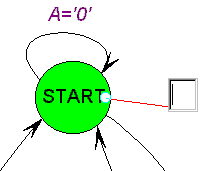
NOTE: If you see the following crossed circle, it means that the transition is not connected with the state:
To connect the transition, drag the circle to the state bubble .
Place 8 transitions lines as shown in the below picture:
Bend the transition lines for a better visual appearance.
Adding transition conditions
Usually, transitions in a state machine depend on its
inputs.
In the previous sections we have placed transitions which force states to change on each
active edge of the clock.
To model the behavior of a state machine under input conditions we have to add conditions
to transitions.
To move the condition select it and drag to the desired position.
If you select a condition, it starts flashing and a gray
line pointing to the transition line appears. In this way FSM indicates to which
transition line a given condition belongs.
If you want to edit a condition, select it and then click the left mouse button again. An
edit box will show up.
To delete a condition, select it and then press the DEL key.
NOTE: All transition conditions have VHDL specific syntax.
Adding diagram actions
Each control unit has to have outputs. Outputs are driven
by "actions".
The following actions are supported:
Now, you will place a state action for the Start state.

To move the condition, select it and drag it to the desired
position.
If you want to edit the condition, select it, and then click the left mouse button again.
An edit box will show up.
To delete the condition, select it and press the DEL key.
NOTE: All actions have VHDL specific syntax.
Next, we will add transition actions.
If an object has passed both detectors we should generate a clock signal which advances
the counter.
We can do that by adding an additional state which drives the DETECTED signal or we
can add an action which is performed only when A=’0’ and
B=’0’ and the current state is StateB.
The transition action is typical for Mealy machines where output state can depend on
machine’s inputs.
NOTE: All actions have VHDL specific syntax.
Specifying the state machine properties
The following menu appears:
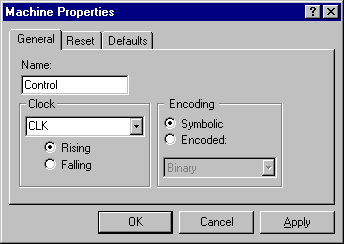
- Expand the Clock drop-down list
- Select CLK signal name
- Make sure that the Rising option is checked
This will add the CLK signal as a rising state machine clock.
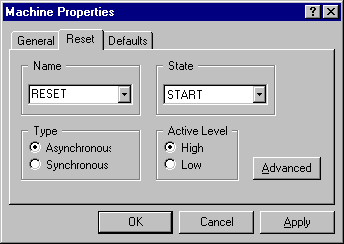
The reset signal is indicated as a triangle with a transition line pointing to the initial state.
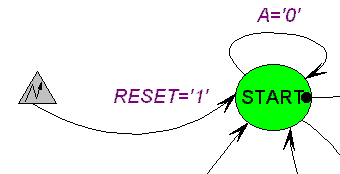
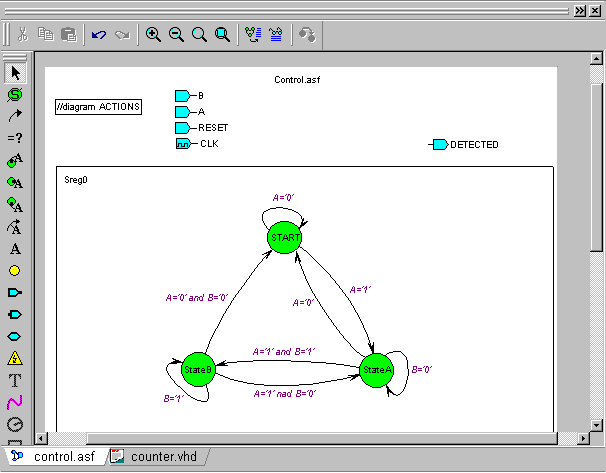
The machine should look like this:
VHDL source code generation
The Design Browser contents after the above operations is shown below:
- RESET
- A
- B
- Count
Active-VHDL features a powerful debugging tool with the
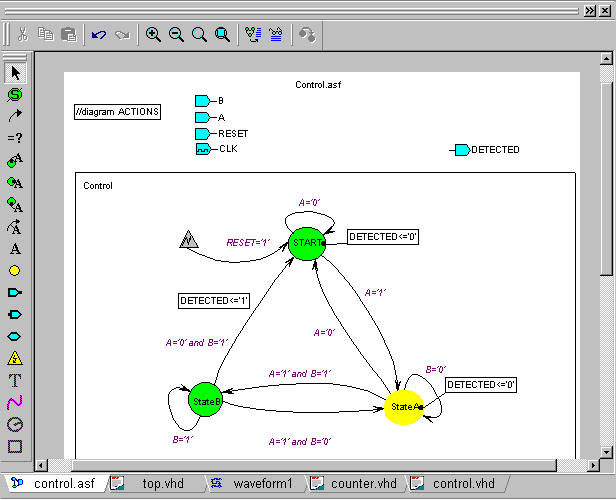
state machine simulator. Since it provides a design animation, you can view how different
input signals affect the machine behavior. The currently executed state is highlighted and
all state transitions are clearly visible. As simulation progresses and different input
signals are fed in, other states are highlighted.
The state machine can be simulated using the generated VHDL source code, as well.
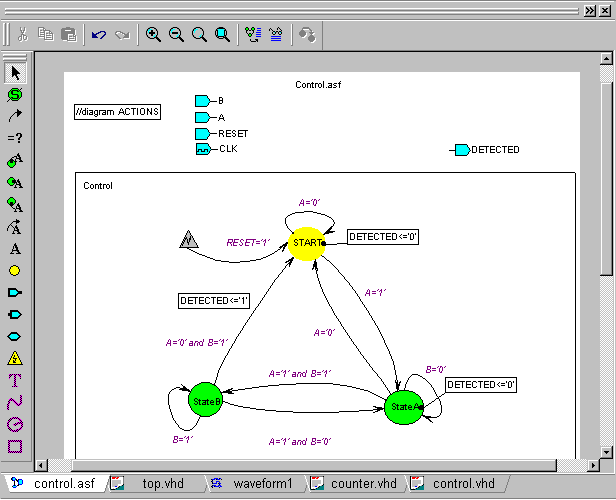
The yellow color of a bubble indicates that it is the current state.
This training has demonstrated how useful and convenient
tool Active-VHDL is.
The design was simulated and verified not only at the VHDL level, but also at the state
machine level. This feature makes Active-VHDL especially suitable for beginners.
The software is a good solution for more advanced users, because it contains simulator
with advanced debugging functions.
Thank you for using Active-VHDL !